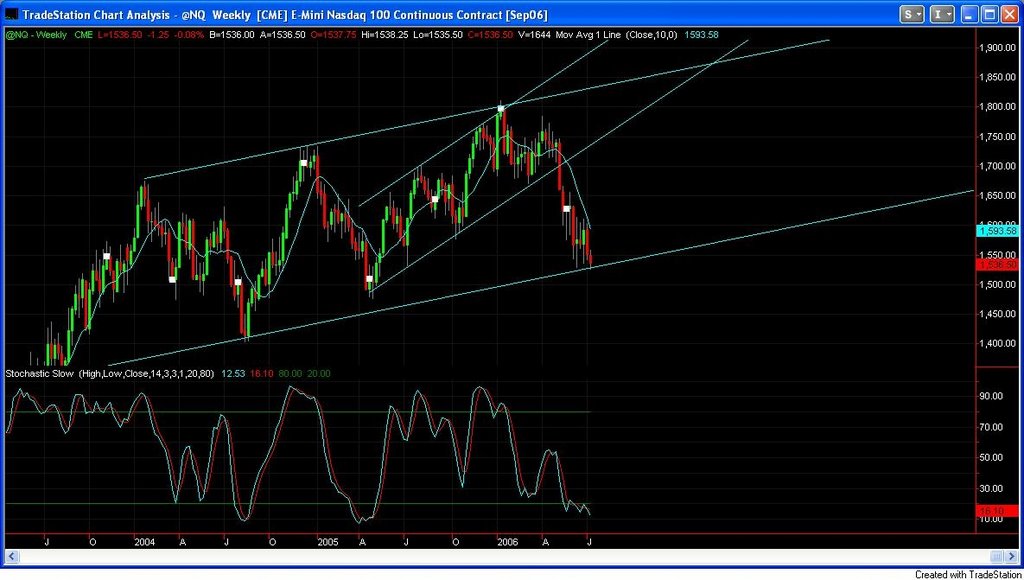
chart order: Wkly, daily, 15, 5min NQ
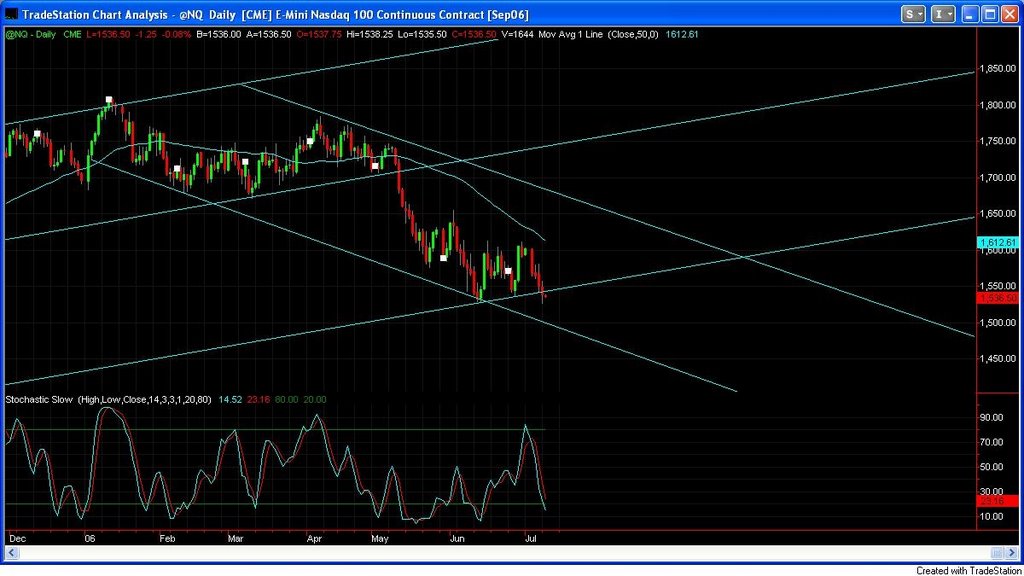
I spent the better part of the day looking for a spot to buy the NQs. On a weekly chart, I still feel we are in a bullish trend. I haven't tried to post any charts on here, but when I am done writing, I will attempt it. The channel I have drawn makes it seem that now, despite all the bears, now would be the best time to buy some Nasdaq futures (1526ish). When I take a closer look on a daily chart, I see two things: 1) since Jan 11th 206, we have steadily come down in a nice bearish channel and this channel is still intact and 2) the bearish channel from Jan 11th, hit the bottom of the weekly bullish channel today. What does this mean to the average trader? It means two things, either look so sell on a daily level, or look to buy on a weekly. To me, I know that the stronger of the two trends is the weekly trend. So, I am looking to buy per the weekly.
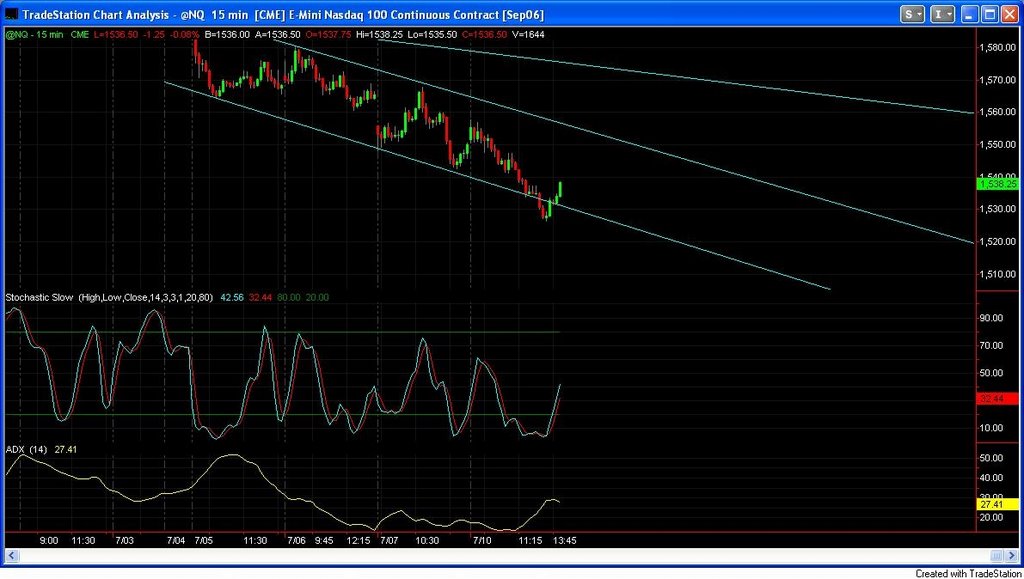
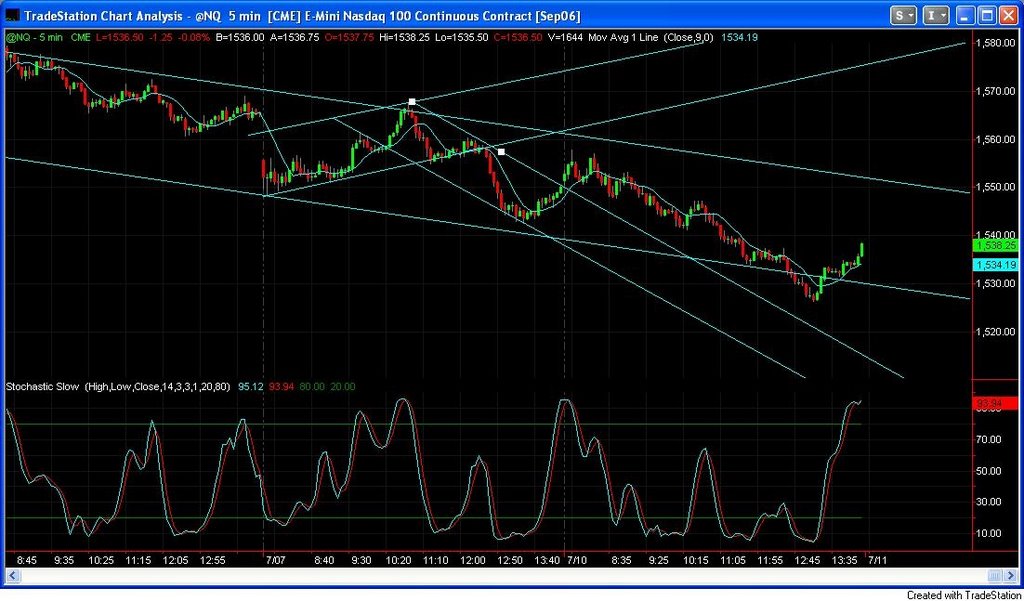
Given that, I have to find a good place on a daily and then a 60 minute, 15 minute and on down the line to a 5 minute chart to pinpoint a solid entry. The 60 minute gave me nothing all day, but the 15 and 5 were golden. After a nice headfake on the 5 minute where I got in around 1534, and got stopped out at 1531, a better entry on both the 15 and 5 minute charts occured around 1531.75 at around 12:50 pacific time. that is where I got in. Sorry if the charts don't work.

No comments:
Post a Comment